Services
- Static Equipment & Structures (Piping Vibration & Fatigue)
- Acoustic Fatigue Assessment for Blowdown Systems
- Acoustic-Induced Vibration (AIV) Analysis
- Finite Element Analysis (FEA) and Computational Fluid Dynamics (CFD)
- Flow-Induced Turbulence (FIT) Analysis
- Flow-Induced Vibration (FIV) Analysis
- Multiphase and Slug Flow Analysis
- Pipe Stress Analysis
- Piping Vibration and Integrity Assessment
- Review & Design Support Services
- Small-Bore Connections (SBC) Assessment
- Structural Vibration and Dynamic Design Analysis
- Subsea Piping Vibration
- Thermal Striping
- Tube Failure Analysis
- Veridian AM
- Veridian VS
- Vibration Inspection Program
- Water Hammer Analysis
- Machinery Analysis
- Bottle Sizing Service
- Compressor Package Engineering
- Finite Element Analysis (FEA) and Computational Fluid Dynamics (CFD)
- Foundation Design and Dynamic Analysis
- Fuel Gas Compressor Piping Transient Analysis
- Lateral Vibration Analysis
- Pipe Stress Analysis
- Pulsation & Mechanical Analysis: Reciprocating Compressor
- Pulsation & Mechanical Analysis: Reciprocating Pump
- Pulsation & Mechanical Analysis: Screw Compressor
- Pump RCF Analysis
- Review & Design Support Services
- Shell Transverse Acoustical (STA) Analysis
- Skid Design and Analysis
- Surge Control Design for Centrifugal Compressor Systems
- Torsional Vibration Analysis (TVA)
- Field Engineering & Troubleshooting
- Finite Element Analysis (FEA) and Computational Fluid Dynamics (CFD)
- Human Vibration
- Motion Amplification Vibration Analysis
- Noise Troubleshooting
- Performance Assessment (Thermodynamic)
- PostPro – field data processing and analysis
- Structural Vibration Troubleshooting
- Thermal Striping
- Troubleshooting, Root Cause Analysis (RCA)
- Veridian iDAC
- Vibration Inspection Program
Machinery Condition and Performance Monitoring
Monitor, Analyze, Optimize
Best-in-class reliability and asset management relies on an effective monitoring program. The challenge is finding the right service that meets your operating needs and budget. Wood understands machinery reliability. We also understand that monitoring must deliver value to your maintenance and operations teams.
Contents [ hide ]
- Service
- Related Information
- Monitoring Examples
- 1 Declining Engine Oil Pressure Caught
- 2 Centrifugal Compressor Examples
- 2.1 Motor Driven Centrifugal Compressor
- 2.2 Centrifugal Compressor Deviation from Baseline
- 2.3 Offshore Platform Units - Varying Gas Turbine Inlet Differential Pressure Indicates Air Filters Being Bypassed
- 2.4 Predictive Maintenance - Oil Filter Differential Pressure Change
- 3 Reciprocating Compressor Examples
- 3.1 Fouled Heat Exchanger Identified
- 3.2 Identifying a Subtle Compressor Vibration Change Prevents a Costly Major Failure
- 3.3 Pipeline Company - Significant Damage to Reciprocating Compressors Averted
- 3.4 Subtle Compressor Performance Problem Detected
- 4 Virtuoso Monitor Software
Service
We deliver:
- Unit, fleet or plant summary and report cards
- Alerts and recommendations to avoid downtime and production losses
- Advice on where to focus your maintenance efforts to achieve the best financial return.
Our approach offers many advantages:
- Monitoring of any rotating and reciprocating machine (turbines, engines, motors, compressors, pumps, etc.)
-
Comprehensive program tailored to your needs. Analysis options include:
-
Vibration
-
Performance
-
Lube oil
-
Troubleshooting
-
Optimization and reliability support
-
-
Practical recommendations and advice from our machinery experts
- Competitive costs compared to OEM-based approaches
- Real time trending, alarming and reporting without the need for expensive software or hardware purchases
Contact us for a demo of our system or to discuss monitoring options for your facility.
Related Information
- Technical paper: How Business Intelligence Tools Can Drive Asset Performance Management Improvements
- Free webinar: (Digital) reliability = profitability
- Service: Remote Vibration Analysis and Condition Monitoring
Monitoring Examples
The following examples illustrate how Wood’s program can generate significant value.
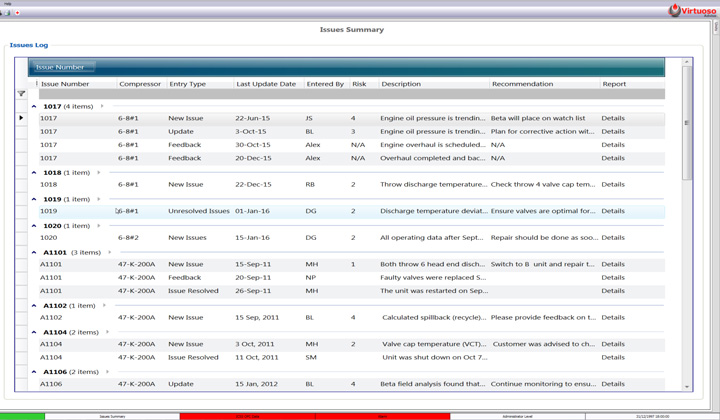
1 Declining Engine Oil Pressure Caught
An engine oil pressure pattern anomaly was observed by a Wood analyst. The pressure was seen to be on a downward trend, though still at acceptable levels.
First alert was sent to the customer on Aug 20
A second alert was sent to the customer 11 days later, on Sep 1, with a high risk level calling for immediate action.
Customer’s reaction:
“Looks like B Pool engine oil pressure is fading. We'll lose an engine if we don't take action.“
The customer reported finding the oil relief spring worn into the housing.
The problem was corrected and oil pressure returned to the normal range.
Feedback from customer: "Thank goodness Wood [formerly BETA Machinery Analysis] identified the problem, which avoided unplanned downtime and may have saved the engine."
2 Centrifugal Compressor Examples
2.1 Motor Driven Centrifugal Compressor
This example is from a motor driven centrifugal compressor. Performance was analyzed over a one year period using control system data.
The graph shows that polytropic efficiency (red curve) decreased steadily from 66% to 58%. Motor power (black curve) to deliver the same flow increased by about 100 kW. If the driver is operating below its rated power, as was the case here, the main consequence is an increase in operating cost. When the driver reaches its limit, any further efficiency decrease causes a loss of throughput, which is usually very costly.
Decreasing efficiency is likely due to some combination of impeller fouling, impeller wear, and/or increased clearances. Monitoring enables planning and scheduling maintenance on an informed basis.
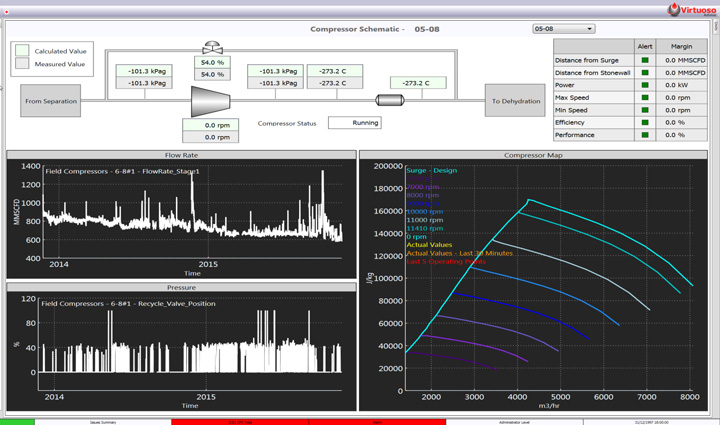
2.2 Centrifugal Compressor Deviation from Baseline
In this case, centrifugal compressor performance is evaluated against the wheel curve baseline for this particular unit. This is the best approach to monitoring centrifugal compressor performance, especially where operating conditions vary significantly.
In the figure below, this unit had an 11% deviation in head at the point shown, likely due to impeller fouling, impeller wear, and/or increased clearances.
.gif)
The decrease in stage performance (measured as head deviation) required extra power to compress this gas; about 325 BHP in this case. It was estimated that the extra fuel cost was over $250,000 per year, based on prices at the time.
2.3 Offshore Platform Units - Varying Gas Turbine Inlet Differential Pressure Indicates Air Filters Being Bypassed
 Several large gas turbine/centrifugal compressor units located on offshore platforms were being monitored under Wood’s Performance Assessment service. One important parameter is the measured differential pressure across the inlet air filters on the gas generator section of the gas turbine.
Air inlet differential pressure had been quite steady at 1.5 – 2.0 in. H2O. Then, near the end of September, 2011, the reading started to vary, from about 2 in. H2O down to zero.
The concern in this case is the low, near zero readings as these indicate that air was bypassing the filters at that time.
A closer inspection shows that there were peaks about every 24 hours. The zero readings were mostly occurring during the hottest part of the day. (This site is around 20 degrees north latitude.)
It was concluded that a filter had been replaced and the fit of the replacement filter was not quite correct; thermal distortion of the inlet ducting allowed air to bypass the filter during the hottest part of the day. The problem with this situation is that dust and other contaminants can accumulate on the initial stages of the gas generator compressor causing performance to decrease rapidly.
2.4 Predictive Maintenance - Oil Filter Differential Pressure Change
Operating data from eight large gas turbine/centrifugal compressor units is reviewed regularly by one of Wood’s monitoring specialists, who communicated the following issue to the customer on November 24th:
| ISSUE NOT YET RESOLVED | |
|---|---|
| Observation/Action | Unit 1 power turbine oil filter differential pressure (tag DPT-301) has been trending up and reached 11 psi on November 19. |
| Recommendations | Plan for filter change; probably within 1 month |
| Probability | 2 - Medium (likely) |
| Consequences | 2 - Medium - equipment shutdown |
| Risk Level | 1 - Perform action ASAP |
The graph below illustrates what happened to that point and subsequently. The cursor (vertical red line) is parked at November 19th. The horizontal solid black line is an alarm level of 15 psi. By December 2, eight days later, the differential pressure reached the alarm level. The customer changed the filter on December 7th. Early warning from Wood enables planned maintenance, avoiding, or minimizing lost production that could occur due to a machine trip.
3 Reciprocating Compressor Examples
3.1 Fouled Heat Exchanger Identified
An FPSO has three large motors driving critical reciprocating compressors. Wood’s Performance Assessment service was monitoring these compressors and motors. Rising winding temperatures were seen in the B unit motor. Although well below alarm levels, the temperatures were higher than the equivalent readings from the A and C motors. The customer was alerted.
| NEW ISSUE | |
|---|---|
| Observation/Action | B1105, created Jan 16, 2012. Unit B motor winding temps are near 115 ºC and have been rising steadily since Dec 30. Comparable unit A temperatures are about 95 °C and unit C about 85 °C. |
| Recommendation | Verify measurements; ensure proper cooling flow. |
| Probability | 2 - Medium (likely) |
| Consequences | 1 - Major - major equipment failure |
| Risk Level | 2 - Perform action as soon as possible |
The customer promptly investigated, found and corrected problems with a heat exchanger.
| ISSUE RESOLVED | |
|---|---|
| Observation/Action | B1105, created Jan 16, 2012. Unit B motor winding temps reached 116 °C and were rising steadily. Unit A motor winding temperatures were about 95 °C, and unit C motor about 85 °C. |
| Recommendation | Verify measurements; ensure proper cooling. |
| Resolution | Inadequate cooling flow and fouled seawater exchanger were found and corrected. |
| Probability | 0 - Not analyzed |
| Consequences | 0 - Not analyzed |
| Risk Level | 5 - No action required |

This proactive intervention enabled correcting the problem with no loss of production. Without monitoring, the exchanger performance may have degraded until temperatures hit alarm level, requiring emergency response and possible lost production.
For more information about Wood’s cost effective remote condition and performance assessment service, contact info.vdn@woodplc.com. The service covers all types of equipment used in gas compression.
3.2 Identifying a Subtle Compressor Vibration Change Prevents a Costly Major Failure
On August 27, 2012, when performing a regular review of reciprocating compressor units for a customer, one of Wood’s analysts sent the following communication to the customer:
“I am seeing a clear compressor vibration increasing trend. Current level of vibration is not very high but a trend is obvious. I do not see any speed/load change on this unit.”
The vibration was still well below the alert level, but was recognized as abnormal by the remote monitoring specialist.
On October 11, 2012 Wood received this communication from a grateful customer:
“Because of your alert we investigated and found that the small end bushing in the #2 throw of the compressor had failed. We have corrected the issue and the unit has been online since Oct 5th, 2012 with the new bushing installed. The vibration levels appear to have returned to their nominal values. Thank you.”
 |
| Connecting rod bushing failure |
Significant and costly damage was avoided thanks to Wood monitoring the unit. This failure would likely have eventually resulted in seizure of the assembly and a major wreck.
3.3 Pipeline Company - Significant Damage to Reciprocating Compressors Averted
While monitoring a fleet of compressors owned by a large pipeline company, the assigned Wood specialist found a discharge temperature deviation on unit 3 and alerted the customer.
The following alert identifies what was observed, the probability and consequences of risk and provides a recommended course of action. In both cases shown, the consequence of inaction is significant equipment failure.
| New Issue for Unit 3 | |
|---|---|
| Observation/Action | Issue raised Feb. 11, 2013. Discharge temperature deviation on throw 4 has been increasing since Jan. 30 2013 and reached from 14 to 24 °C on February 11, 2013. |
| Recommendations | Check throw 4 for a valve problem. Also check lubrication rates on this throw. |
| Probability | 1 - High (very likely) |
| Consequences | 2 - Significant - equipment failure |
| Risk Level | 2 - Perform action as soon as possible |
 |
| Unit 3, Throw #4 |
The unit was discovered to have one failed head end discharge valve.
A similar problem occurred on unit 21, throw # 2 and the unit was discovered to have two failed crank end discharge valves.
| New issue for Unit 21 | |
|---|---|
| Observation/Action | Issue raised Feb 11, 2013: Discharge temperature deviation throw 2 stage 1 has increased from 8 to about 16 °C since Feb 05, 2013. |
| Recommendations | Check throw 2 for a valve problem and/or lube rates on this throw. |
| Probability | 1 - High (very likely) |
| Consequences | 2 - Significant - equipment failure |
| Risk Level | 2 - Perform action as soon as possible |
Benefit of the Monitoring Program
The early detection of failing compressor valves preserved compressor capacity and efficiency, and prevented secondary damage that can occur if a valve disintegrates. The second case is particularly significant; failed crank end discharge valves can lead to catastrophic failure, as the rod load tends toward continuous tension with little, or no reversal. Fortunately, the customer took immediate action and both units were repaired within four days of receiving the alert, averting significant equipment failure.
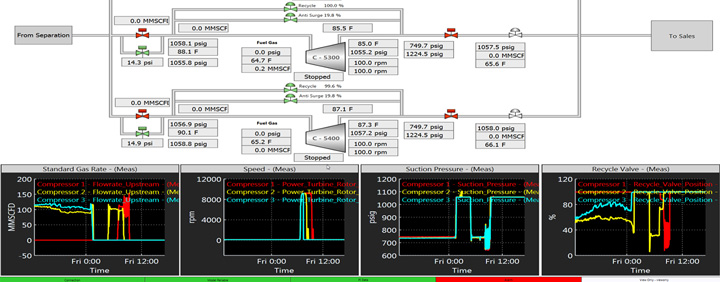
3.4 Subtle Compressor Performance Problem Detected
Subtle faults usually turn into big problems and early warning can head off major failures. This example arises from remote monitoring of a four throw, two stage gas compressor. Throws 2 and 4 are on stage 1; throws 1 and 3 are on stage 2.
Rather than monitoring raw temperature data, the following chart is based on a derived measure called “discharge temperature deviation.” The “deviation” is the difference between expected versus measured discharge temperature.
This graph shows a history of cylinder 4 discharge temperature (the black curve). Close examination shows a small increase, but not enough to cause any concern.
For more information about Wood’s cost effective remote condition and performance monitoring service, contact info.vdn@woodplc.com. The service covers all types of equipment used in gas compression.
However, we see significant increase (red curve). This usually points to a valve leak or possibly a ring leak.
For confirmation we can check the stage compression ratios. The stage 1 compression ratio decreases and the stage 2 compression ratio increases. This is consistent with performance degradation on stage 1.
Further confirmation is found from measured flow (after the recycle valve) and recycle valve position. Over the same time period as the previous graphs, the flow is essentially constant. But the recycle valve position decreases from about 20% to about 15%.
The data indicates a loss of compressor throughput. Conclusion: There is a valve or ring leak on throw 4.
This example illustrates that detecting subtle problems like this one requires advanced techniques in the hands of trained specialists. Automated processing procedures that rely on simple methods such as looking for a significant temperature change would likely not have detected this.
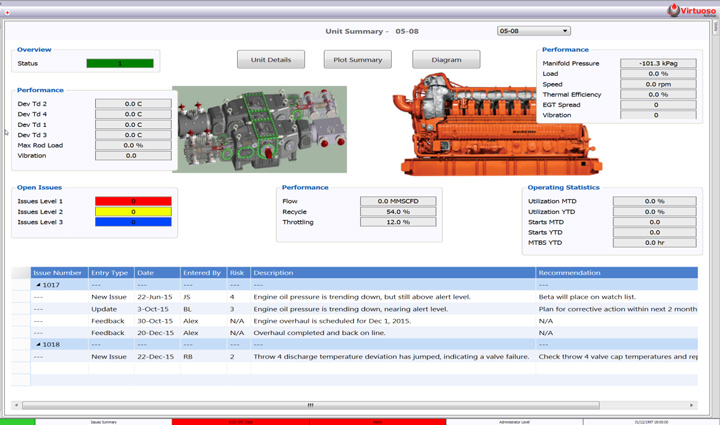
4 Virtuoso Monitor Software
![]()
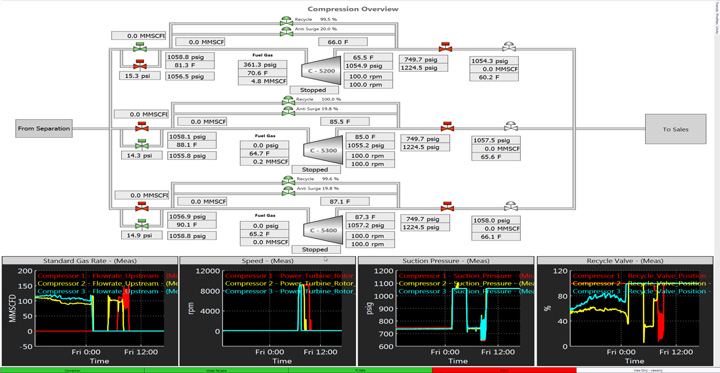
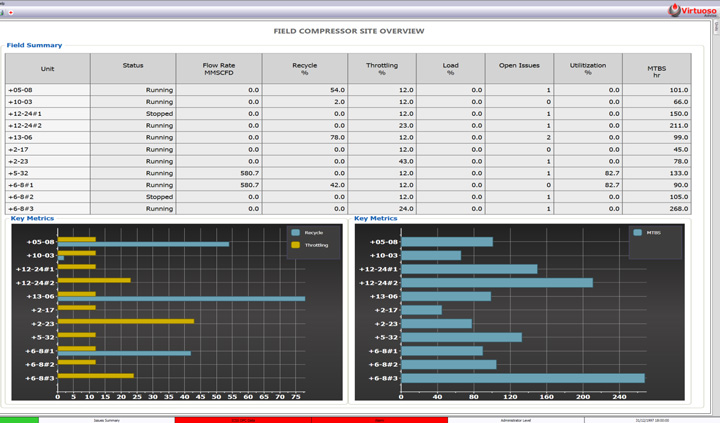
Wood uses Virtuoso®/Monitor - a robust, online, real-time, dynamic simulator for monitoring oil and gas production.
Monitor's functionalities include liquids inventory management, line pack monitoring, composition and chemical tracking, hydrate warnings, leak detection, pig tracking, instrument/equipment surveillance and much more. Monitor's functionality makes it an essential tool for monitoring production systems. Read more
|
|
 |
 |
 |
 |
More Info
Webinar: Vibration problem solving – back to basics • Webinar: Rotating machinery vibration diagnostics • Multi-channel vibration measurements • Five simple methods to check reciprocating compressor performance • Webinar: Feeling the pulse • Webinar: What is my risk of surge? • Design Requirements for Reciprocating Compressors • Evaluating Compressor Operating Risks • Tips for Managing a Successful Vibration Project • Specifications •
Free webinar

Learn how to solve complex vibration problems with advanced troubleshooting techniques to keep your facility running smoothly, with minimal downtime. Watch now