Note: This transcript is auto-generated and may contain errors.
Knowledge Center
- Downloads
- Technical Newsletter
- Recommended Guidelines and References
- Specifications
- Technical Papers
- Tools and Calculators
- Training
- Articles, Tips and Requirements
- An Integrated Approach to Manage Vibration Risks
- Design Requirements for Reciprocating Compressors
- Evaluating Compressor Operating Risks
- Five simple methods to check reciprocating compressor performance
- Important Differences in Pulsation Software
- Liquid Pumping Systems (Including Liquid Pipelines)
- Noise Regulations Around the World
- Noise Risks in the Gas Industry
- Performance Monitoring Examples
- Pipe Support Stiffness, GMRC Project
- Piping Vibration Design Considerations
- Piping Vibration Examples
- Structural Vibration and Ways to Avoid It
- Tips for a Successful Project (Vibration Control)
- Transient Conditions on Small-Bore Piping
- Vendor Requirements for Piping Vibration & Integrity Assessment
- Vibration-induced fatigue (whitepaper)
- Vibration Issues Affecting Gas Compressor Facilities
- Ask the expert
Rotordynamic vibration diagnostics – ask the expert
Q&A from our vibration troubleshooting webinar "Need for speed – understanding vibration for high-speed rotating machinery diagnostics"
By Wally Bratek, MSc, PEng
Watch the replay Speak to an expert
The answers below were given in the context of the webinar and do not address all aspects of the issues discussed.
For more comprehensive information or application support, we strongly encourage you to contact our experts directly.
1 Data acquisition and equipment
 |
|
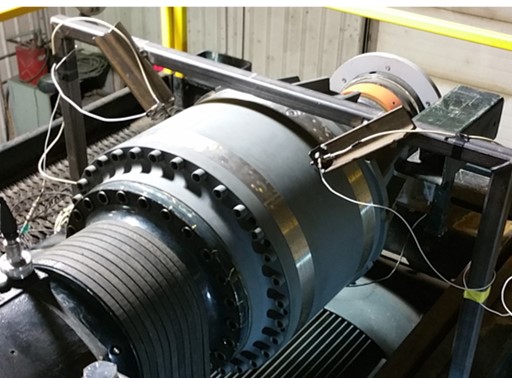
All rotating machines can be equipped with temporary proximity measurement systems. If the housings does not have provisions to install probes, they can be installed on brackets or with a magnetic base (make sure to also measure the bracket vibration). |
Can we connect the proximity probe directly to the vibration analyzer? Can the analyzer do the demodulation itself?
No. You’d need a proximitor or transmitter that is configured for the correct electrical length of the probe and extension cable. I have not seen any analyzers that can read directly from a probe.
What is the of the accuracy of vibration amplitude using proximity probes on a magnetic base?
We have had good success using magnetic bases to hold proximity probes. However, it is important to ensure that the magnetic base arm is not vibrating. The first thing that we do with this setup is to complete a ring test on the mounted probe while the machine is not running.
From the proximity probe signal, we can determine the base mechanical natural frequency. If the frequency is close to the operating speed, then we will adjust the configuration to change the base natural frequency. Once we are satisfied that the base mechanical natural frequency is different than the operating speed, we will still note the frequency so it can be ignored in the vibration plots.
The magnetic base vibration will be obvious in the cascade plots as a vibration peak that does not change with machine RPM, and then this can be ignored.
How do unburnished or unprofiled rotors affect the accuracy of temporary proximity probe mounting?
The compensation process becomes more critical when using unprofiled surfaces, so it is important to clean up any scratches that could be more problematic. If the scratches are smoothed out, hopefully, what is remaining will be 1x, 2x run-out that is easy to subtract from the vibration signal. Usually, this approach is acceptable for balancing.
Can a transmitter also do the demodulation of the proximity probe signal?
Yes, we use them for troubleshooting.
When using a transmitter, shall we have a driver (proximitor) as well?
No. Most transmitters have BNC connection or terminal connections to obtain the raw dynamic signal to use with a portable vibration analyzer. Proximitors are used mostly with a panel monitor. The transmitters do the same demodulation as proximitors but include a 4-20 mA output for overall vibration amplitudes.
Could you use an iPhone for vibration measurements?
Yes, but only to about 45 Hz. The sampling rate for iPhones is 100 Hz. Therefore, to avoid “aliasing” it should only be used when you are sure that the vibration is less than about 45 Hz. Also, the mounting is not very good to determine amplitudes, especially if you have a case. For higher frequency vibration, you could use the microphone to determine the frequency, if it’s audible.
2 Interpretation and analysis
 |
|
Blue trace: uncompensated, red trace: compensated Slow roll compensation removes slow-roll runout from the filtered signal (1X) so only the dynamic response remains. |
How do you do the slow-roll runout?
For slow-roll runout compensation, you simply record the vibration at a low RPM. Usually 300-400 RPM. I recommend looking at the Bode plots and choosing an RPM where the vibration amplitudes and phases are not changing with changes in RPM.
If the chosen RPM is too slow, there might be measurement errors. If the chosen RPM is too high, then the vibration amplitudes and phases might start to shift due to dynamics.
For filtered measurements (1x, 2x, etc), the slow-roll vibration can be recorded as a vector (amplitude and phase). This is the most common type of compensation.
How do you compensate the data based on a slow-roll runout?
For filtered/vector compensation, you only have to subtract the slow-roll vector from the operating speed vector. That will show you the amount of vibration resulting from rotor dynamics and remove the vibration that is due to shaft imperfections.
Sometimes, with temporary proximity transducers, it is difficult to get the slow roll compensation for the shaft runout either mechanical or electrical. Do you have any tips to improve that?
Regarding the slow-roll compensation, most often we are concerned with 1x, sometimes for balancing. Even if the slow-roll has a large amplitude at 1x, we can still compensate for this by subtracting from the operating vibration 1x. The subtraction may not be perfect, but it is usually sufficient to allow us to see the change in vibration at operating speed due to the addition of a trial weight. Note that if there is a large amount of slow-roll displacement, this could also indicate that the rotor is bowed.
Some manufacturers do not have accurate frequency-dependent coefficients of bearing damping and stiffness, which create modeling problems. How do you solve that?
Stiffness and damping coefficients can be calculated for most bearing geometries in rotordynamics software. Most of the bearing codes are based on papers that include measured/empirical data and have been verified against field data. We use xLRotor software to calculate these. The OEM should be able to provide the coefficients.
What vibration or rotor-related data or plots are useful and should be requested from the turbomachinery manufacturer?
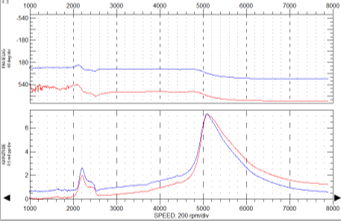
The original rotordynamics report would be the most important. This will tell you what the predicted critical speeds and amplification factors. The shop test vibration report is also important. The shop test vibration report should include Bode plots for all of the vibration probes, from slow-roll to full operating speed.
 |
|
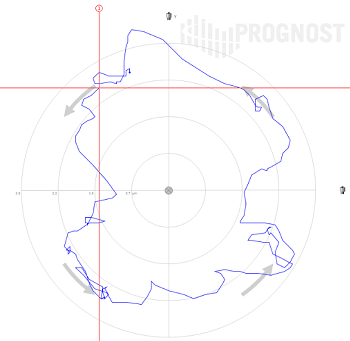
Bode plots have an amplitude peak and significant increase in phase lag, whereas Polar plots show rotor modes with large curving loops, also called polar circles, and structural modes and split resonances due to anisotropic bearing stiffness with smaller loops. |
Can the shaft centerline plot be utilized to detect misalignment?
Yes. There is an expected or normal shaft centerline movement for journal bearings. For gravity loaded bearings, the rotor should be sitting on the bottom of the journal when stopped, then rise up to some eccentricity ratio and attitude angle at operating RPM, depending on the bearing type.
This is similar for gear-loaded bearings but have to account for the gear load. The expected shaft centerline behavior is sometimes available in the OEM rotordynamics report, or you could ask for it. If the actual shaft centerline movement is different then what is expected, then you’d have to ask yourself why, and misalignment could be the reason.
Also, misalignment often will show up in pairs. For example, if you had an electric motor driving a hot oil pump, let’s say that the pump is going to rise and put the machines out of alignment. In this case, the drive-end bearing on the pump would show the rotor being forced to the bottom of the journal in the shaft centerline plot, and the drive-end bearing on the motor would show the rotor being forced to the top of the clearance. You might also see 2x vibration.
Would a rotor rub only be depicted in full-spectrum? What about the rubbing to show up with half-order harmonics?
Yes, rotor rubbing can result in 1/2x, 1x, and sometimes 2x vibration. The full spectrum is nice because it tells you that the orbit is getting elliptical, which is an indication of a rub. The shaft rubbing may also be apparent in the shaft centerline plots if the rub is in the bearings and the rotor is displaced to an amplitude close to the bearing clearance. Rubbing can also be indicated in the orbit plots if there is a “bounce” or a sudden change in direction that can be seen.
I have an orbit plot that has no pattern and doesn’t seem to come back to the original position. The measurements are very small, though. It is rotating at 8275rpm, has constant speed, and the plots don’t have any continuous mode, shifting into complex shapes of very small amplitudes. What could this be?
 |
| Orbit plot dominated by 1x and some higher frequencies that could originate from runout, structural resonance, blade pass energy or gear mesh. |
The orbits look healthy. Overall amplitudes are very low, 5 micron or 0.2 mils pk-pk. They are dominated by 1x and look to have some higher frequency content such as 4x or 5x. This could be coming from runout (not sure if it is compensated), structural resonance, blade pass energy, or gear mesh, if applicable. But the amplitudes are low, so it looks OK to me.
One unusual thing is that the orbit is reverse whirl. This could be rotation direction in the setup is in error, or x/Y probes are reversed. That’s most likely the cause so I’d check for that.
If the bearing housing is having high vibration, will this be seen in the proximity probe data?
Yes. Often, we will measure both casing vibration along with the shaft relative vibration with proximity probes. In most cases, the casing vibration amplitudes are low enough that we can ignore them.
However, if the casing vibration is significant, it can be vectorially subtracted from the proximity probe data. To know the actual amplitude of the casing vibration, however, transducers will have to be used such as accelerometers or velometers.
What are some things to look for in shaft centerline measurements?
It is important to review how the shaft centerline changes from stopped to full operating speed. There is expected/normal shaft centerline movement for journal bearings. For gravity-loaded bearings, the rotor should be sitting on the bottom of the journal when stopped, then rise up to some eccentricity ratio and attitude angle at operating RPM, depending on the bearing type. This is similar for gear-loaded bearings but you have to account for the gear load. The expected shaft centerline behavior is sometimes available in the OEM rotordynamics report, or you could ask for it. If the actual shaft centerline movement is different than expected, this could indicate a bad bearing or misalignment.
 |
| Orbit plot characteristics |
3 Other
Does Wood have any experience with lower speed (1200-1800 rpm) rotodynamic pumps like vertical turbines?
Yes, we do quite a lot of work with vertical rotordynamic pumps. We complete structural, lateral, torsional dynamics analysis per API 610 and Hydraulic Institute standards. We also do field commissioning measurements and troubleshooting and many vertical pumps. Often, we must mount proximity probes with temporary brackets in the stuffing box area.
What are advantages of tilt pad bearings?
Tilt pad bearings are typically used when the operating speed is over about 3x of the first critical speed, ie, when operating in a very fast speed relative to the first critical. Maybe even faster than the second critical speed.
In some cases, this can create a stability problem where cross-coupling that exists in conventional journal bearings causes high vibration at a sub-synchronous frequency. This stability problem can be eliminated by using tilt-pad bearings. For lower speed equipment, tilt-pad bearings can also be used to eliminate oil-whirl which is a similar instability.
4 About
 |
Wally Bratek, MSc, PEng Principal Consultant, Field Engineering and Troubleshooting Wally is a principal consultant in Wood’s vibration, dynamics and noise group. His 20 years’ design and field experience include acoustical (pulsation) and mechanical vibration analysis, machinery dynamics, field testing and troubleshooting, alignment, high-speed balancing, lateral rotordynamics, piping flexibility and flow-induced pulsation. Wally has presented multiple papers at industry conferences, is a member of the GMRC Gas Machinery Conference Planning Committee and is an active member of the API 688 2nd Edition task force for pulsation and vibration control for positive displacement machinery. |
-
Transcript
Related Pages
Webinar: Rotating machinery vibration diagnostics • Webinar: (Digital) reliability = profitability • Webinar: What is my risk of surge? • Troubleshooting, Root Cause Analysis (RCA) • Field engineering and troubleshooting •
Free webinar

Learn how to solve complex vibration problems with advanced troubleshooting techniques to keep your facility running smoothly, with minimal downtime. Watch now
